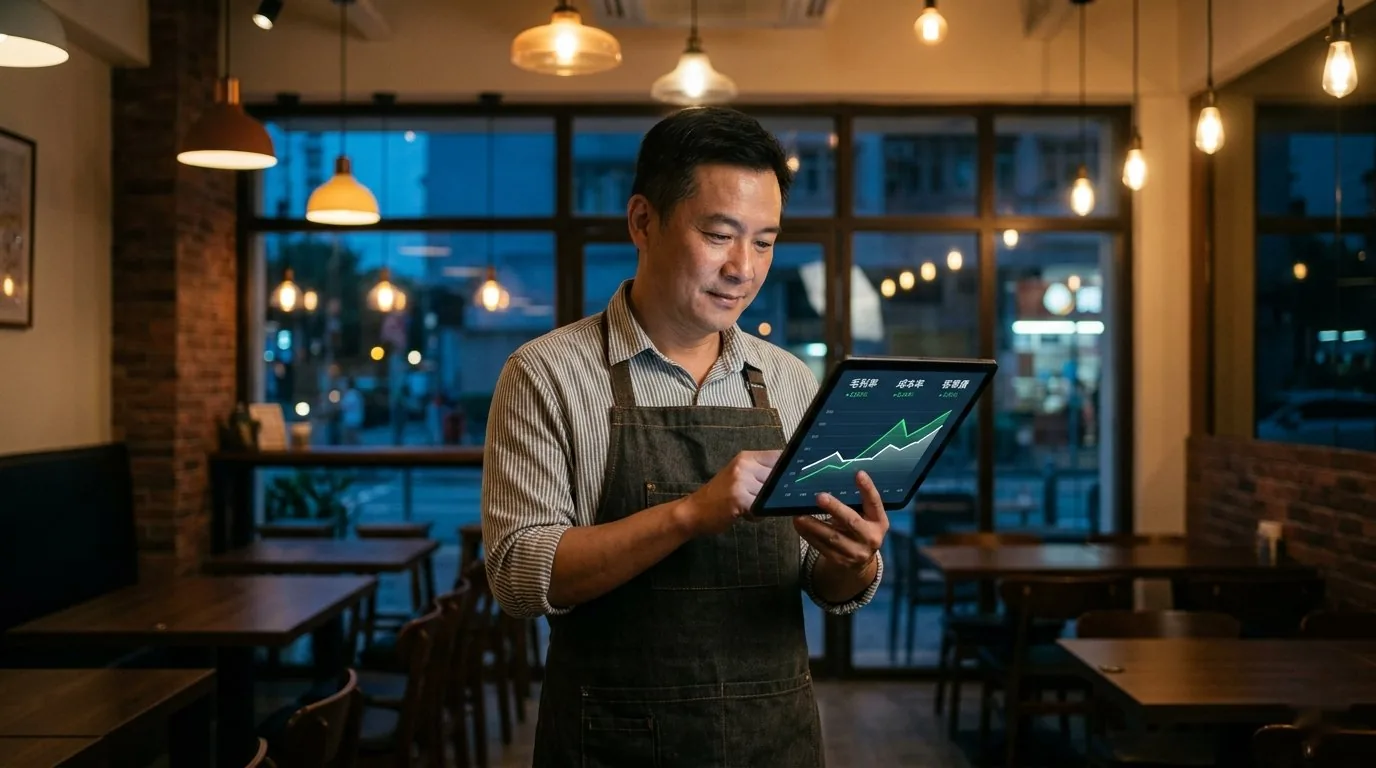
Two restaurants on the same street — similar dishes, similar prices, similar Google ratings. A year later, one was expanding into a second branch and the other had closed down. The difference wasn't cooking skill, and it wasn't location. One owner looked at his data once a week and adjusted item by item; the other only closed the books at month-end — and by the time a problem showed up, it was already too late.
Great food is no longer a competitive advantage — it's the price of entry. In 2026, the gap between restaurants that make money and restaurants that lose it isn't taste; it's how each owner turns everyday data into everyday decisions. This article covers the four applications with the biggest impact on profit, and how to start today.
Key Takeaways
- Menu engineering is about speed, not polish: top operators reprice monthly, not yearly — with three data chains in place, even a monthly review delivers a 5–10% lift in gross margin.
- Negotiate with evidence: bringing "up 9% in the past 12 months while the market rose only 4%" to the table is 10 times more powerful than an empty "you're expensive".
- Par levels should follow demand: weight the past 30 days of usage by day-of-week and fresh-goods wastage falls back into single digits.
- Real-time alerts beat the month-end close: anomalies surface within 24–48 hours, and speed of response often decides the size of the loss.
Doing Menu Engineering Properly
The classic 2×2 matrix (popularity × gross margin) is still the right starting point. What's changed is speed: top operators reprice and rearrange monthly, not yearly. They cross-reference each dish's cost trend against the shop's sales mix — and the moment a "star" starts sliding into "puzzle" territory, it gets flagged.
How, concretely? Three data chains:
- The actual cost of every dish: when ingredient prices move in real time, dish costs must update automatically.
- The actual sales of every dish: broken down by day, by time slot, by day of the week.
- The gross-margin contribution of every dish: cost × volume — only then can you see which dishes genuinely make the money.
With all three data chains in place, even a monthly review is enough to deliver a 5–10% lift in gross margin.
Bringing Leverage to Supplier Negotiations
Traditional supplier negotiation runs on relationships and gut feel. Data-driven negotiation runs on objective evidence.
When you can put in front of a supplier:
- Your total annual spend on each SKU
- Market quotes for the same SKU (i.e. your backup supplier's price)
- Their own delivered-price history over the years
The conversation changes instantly. You're no longer begging for a discount — you're negotiating with evidence in hand. "This item has gone up 9% in the past 12 months while the market equivalent rose only 4%" is 10 times more powerful than an empty "I think you're expensive".
It also explains why data transparency is leverage in itself — once a supplier knows you track every single invoice, they won't dare nudge prices up casually.
Demand-Based Par Levels
A fixed, never-changing par sheet causes both stockouts and waste. The most common mistake: setting the par level from "we use 5kg a week on average", when Monday and Tuesday actually use 2kg and the weekend uses 10kg — the par never matches reality.
Using the past 30 days of usage, weighted by day-of-week patterns — that's the bare minimum for a modern par level. Restaurants that do this can push their fresh-goods wastage rate back into single digits.
The more advanced version: factor in seasonality and events (holidays, sports fixtures, school breaks) and the system can suggest par adjustments automatically. None of this can be done with a spreadsheet.
Detecting Anomalies in Real Time
The biggest advantage of being data-driven isn't after-the-fact analysis — it's real-time alerts.
Your system should be able to catch, as it happens:
- The food cost ratio suddenly spiking in a given week
- A supplier raising prices three times in a row
- A dish's sales suddenly dropping 30% (orders going out wrong? a promotion misfiring?)
- Stocktake variance rates over the limit
These signals are your business's smoke detectors. With a traditional month-end close, problems only surface at the end of the month; the data-driven approach raises an alert within 24–48 hours of the event. Speed of response often decides the size of the loss. (Not seeing when you start bleeding is exactly what most shops in the closure wave had in common.)
Analytics doesn't replace an owner's intuition. It just tells the owner whether that intuition is right.
What "Data-Driven" Doesn't Mean
It doesn't mean a room full of dashboards. The most successful owners we've met actually have fewer dashboards than their peers — they have a handful of decisions they genuinely make every week, and the data each decision needs sits on the screen that belongs to that decision.
Equally, data-driven is not:
- Not about needing an IT department: for a single shop, the owner plus the manager is enough.
- Not about numbers instead of people: data supports decisions; it doesn't replace judgement.
- Not about chasing big data: a restaurant doesn't generate that much data in a year — the point is using it right, not piling it up.
- Not about only looking backwards: genuinely useful analysis always carries an actionable insight on "what to do next".
Where to Start?
For restaurants just starting to go data-driven, we suggest beginning with these three decisions:
- Weekly: food cost ratio — the moment it crosses your line, review immediately.
- Monthly: dish gross-margin ranking — identify your star dishes and your dogs.
- Quarterly: supplier price trends — compared against backup quotes.
Three decisions, three dashboards. Once you're used to the rhythm, expand gradually from there.
How InvSpot Takes You From Guessing to Knowing
All of the above rests on one premise: your data has to be complete, current and reliable. InvSpot uses AI to turn that data into real-time cost clarity — scan an invoice and it computes automatically, no Excel, so you see the bleed while there's still time to fix it. The approach:
- Automatically collects all purchasing, dish and sales data: no manual entry.
- Key metrics updated daily: food cost ratio, gross margin, par levels — all live data.
- Automatic anomaly alerts: no need to watch dashboards all day; when something's wrong, the system finds you.
- Data visualisation: everything in one chart, no hand-built Excel.
In one sentence: InvSpot moves you from "regretting it at month-end close" to "know immediately, adjust immediately".
FAQ
With a small team, isn't data analysis just empty talk for a small shop?
Quite the opposite. A small shop has even less room for error, and every decision carries relatively more weight. The point isn't hiring more people — it's using the right tools. Once things are automated, the owner can do this alone.
Which decision should I start quantifying first?
Usually start with the food cost ratio, because it's a restaurant's largest variable cost. Once you've got that under control, expand into dish margins, par levels and supplier negotiation.
How long until I see results?
After setting up the system and collecting 4 weeks of data, you can already run your first review. Within 3 months, most restaurants see a clear improvement in food cost ratio (typically 2-4 percentage points).
Conclusion
The competitive edge of this era is operational fluency. The restaurants that win aren't the ones with the most data — they're the ones that turn data into action fastest. Pick three decisions you make every week, quantify them, and start today.
With real-time data, every decision — pricing, suppliers, menu — stops being a gut call and becomes one you can test and measure.
Want to see how your shop's daily decisions could be driven by data? Try InvSpot — a handful of metrics is enough to change the rhythm of your business.